Overview
Welcome to Exosite’s ExoSense® condition monitoring application. This onboarding document contains bite-size tasks to help you create your first instance of ExoSense as quickly as possible. It will also introduce you to core ExoSense capabilities, terminology, and tips. You can expect to take approximately three hours to complete the tasks included here.
If you have any questions as you work through this document, feel free to contact the Exosite Support Team directly. For more detailed documentation, visit the ExoSense technical documentation site.
Definitions
The table below explains common terms that will be used throughout this document.
|
Term |
Definition |
|
ExoSense User |
Every user with an email address and password to access the ExoSense application. |
|
Device |
An electronic device with an IP connection that sends data to Exosite’s Murano IoT platform. Devices have a unique identity in the platform and need to be claimed (assigned ownership) into a group within the ExoSense application. |
|
Channel |
An ExoSense concept to identify an individual stream of information sent to ExoSense by a unique device that has a specific unit of measure from the local physical environment (e.g., temperature or status). Channel data is not stored until it becomes a signal. |
|
Signal |
An ExoSense concept similar to channel, but is the part of a virtual asset object that describes and stores the data. Signals can be transformed, exported, visualized, and have rules applied to them. The source for a signal is typically a device channel, but it doesn't have to be. The signal essentially subscribes to its source. |
|
Asset |
Assets are configurable, virtual objects within ExoSense that contain signal data and transformations. Assets can be displayed on dashboards. |
Requirements
Software
Before getting started with ExoSense, please note that you must have a business account set up with the Murano® IoT platform, which can be created here. If your company already has a business account, please request access from the Murano business owner.
For additional information, please see the directions in this ExoSense™ Deployment article to get started.
Other Materials
We also recommend having the following items before you get started:
- Your company logo.
- We will use this to personalize your ExoSense instance.
- Format: PNG or JPG
- Pictures of what you will monitor (e.g., machines, factory floor).
- We will overlay a live stream of data on this image.
- Format: SVG- and DXF-type files, as well as PNG, BMP, TIFF, GIF, and JPEG
- Reformatted sample data.
- We will use this data with the ExoSense device simulator that cycles through pre-recorded data, allowing you to set up and test models without live data. The sample data must be formatted for the device simulator.
- If this is not an option, we also have a CSV of sample pump data available within the simulator. However, we highly recommend using your own sample data if possible. Sample data will you to complete onboarding with real data while you work on connecting your physical device.
- Format: CSV
ExoSense Onboarding Tasks
Personalize Your ExoSense Instance
Objective: Give your ExoSense instance the same look and feel as your company’s branding.
What you’ll need: PNG or JPG of your company logo and a smaller company icon (optional).
Steps:
- Click “Setup,” then click “Theme.”
- At the bottom of the page, you should see boxes labeled “Logo” and “Small Icon.” Drag and drop your images into the appropriate boxes.
- Choose your color theming. We recommended using your logo to figure out your hex values and placing those in the color-related fields.
NOTE: Not sure what the hex values are in your logo? Use this HTML color code tool.
Set Up a Device Simulator
Objective: Get data flowing. In this example, we will use the ExoSense device simulator, which allows you to cycle through simulated data to emulate a sensor or device. This is useful if you are still working to connect sensors or want to set up and test models in unique conditions.
What you’ll need:
- CSV with data in it. Again, it must be properly formatted for the device simulator.
- Alternatively, you can also use the CSV of sample pump data that is available within the device simulator.
Steps:
- Click “Setup,” then click “Data Sources,” and then “Simulators” (click on the “>”).
This will take you to the simulator instance. You can use up to five simulator instances at once. They do disable themselves after 30 days (so we don’t store a year’s worth of simulated data on our servers), but you can re-enable them by toggling the switch at any time. - Click “Add +”, then choose “.csv” from the “Simulator Type” drop-down menu. Drag and drop your file to upload it.
- Double check to see if your channels have populated; if so, the upload was successful.
- Click “Save” and then toggle the switch to enable the device.
You just created a simulated “device” that will replay the data from your CSV file.
Claim a Device
Objective: Claim the brand new device you created in the previous step. This will allow you to add it to a group, which enables device organization and user controls.
Steps:
- Exit the current simulator tab and return to the ExoSense tab.
- Click “Device” and then click “Unclaimed Devices.”
- Find your newly added device and select the checkbox.
- Click “Parent Group” and select the checkbox for the group you’d like to assign it to.
- Click “Assign to Group.” We recommend defaulting to “root node” at first. This essentially puts your device on the homepage. It can always be moved later.
- Click the “Devices” tab; you should be able to see your new device.
NOTE: The device list is dynamic. You may see active (green) devices jump to the top of the list; this makes it easier to find devices once your product goes into mass production.
Create an Asset
Objective: Create a new asset with an associated device. This may seem confusing, since you just created a device. Why do you need to create an asset? Because each dashboard in ExoSense is created from an asset, which could be associated with multiple devices.
Steps:
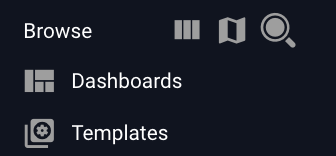
- Click “Browse” at the top left of the sidebar and navigate to the group you’d like to add an asset to.
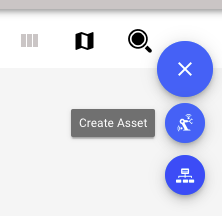
- Click “+” and then click “Create Asset.”
- Add the prompted information and click “Save.” You’ve just created a dashboard. This is where we are going to populate your graphs and other visual aids. First, however, we need to get data.
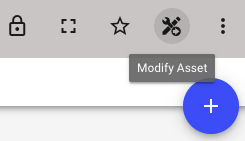
- Navigate to your selected group on your dashboard, find the asset you just created, and click on it. Then click “Modify Asset.”
- Click “Add Signals.” In this case, your signal is the raw historical data sent from the edge device. You can drill up or down through the groups to add however many signals you would like. Eventually this definition will also include your new calculations.
NOTE: It may seem odd that you can select devices that are assigned to different groups, but this allows users to set up multiple versions of hierarchies. For example, a pump would be able to live in a hierarchy for a product-line, a proof-of-concept, and a geographic area .
NOTE: If you would like to use a singular device to create an associated single asset, there is a quick way to do that:
- Click “Device” and find the device you’d like to make an asset.
- Click the three dots then click “Create Simple Asset.”
Create a Hierarchy
Objective: Decide how to structure your ExoSense instance. Some customers group by divisions or products, others group geographically, and others group by customer. Groups do not necessarily have to be visible to each other.
Steps:
- Click “Browse,” then click the three dots and select “Add Subgroup.”
- Type in the name of your subgroup.
- Create any other subgroups you deem necessary.
NOTE: Once created, subgroups are listed alphabetically.
Move an Asset
Objective: Move your asset into one of the subgroups you created.
Steps:
- Locate an asset that you would like to move. Start by clicking “Browse” and drill down until you find the asset.
- Click the three dots next to your asset then click “Move.”
- Drill down to the subgroup you would like to move the asset to and click “Save.”
Create a Dashboard
Objective: Now that you have live data, a device, and an asset, let’s create a dashboard to visualize data.
Steps:
- Click “Browse.”
- Navigate to your new asset and double click it.
You are now in your blank dashboard. Every asset has a blank dashboard associated with it. At the top of the dashboard there are five buttons: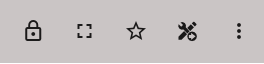
 /
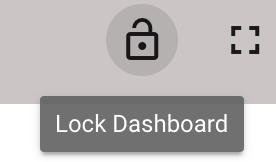
/ = locked/unlocked
When the dashboard is locked, it cannot be edited. If you would like to edit the dashboard, it must be unlocked. Once your changes are complete, you will need to lock the dashboard to save your work. = fullscreen
This increases the size of your dashboard to the width of your screen. = favorite
If you have a dashboard that you’d like to frequently refer to, you can add/remove it to/from your indexed “shortcuts” with this button. = modify asset
This button is how you access your live raw data signals and where functions/insights can be created. = settings
This is where you share, edit, unpublish, and remove your dashboard. - To look at your data to make sure it populated correctly, click on the modify asset icon (the pencil and wrench). This will bring you to a live stream of your raw data.
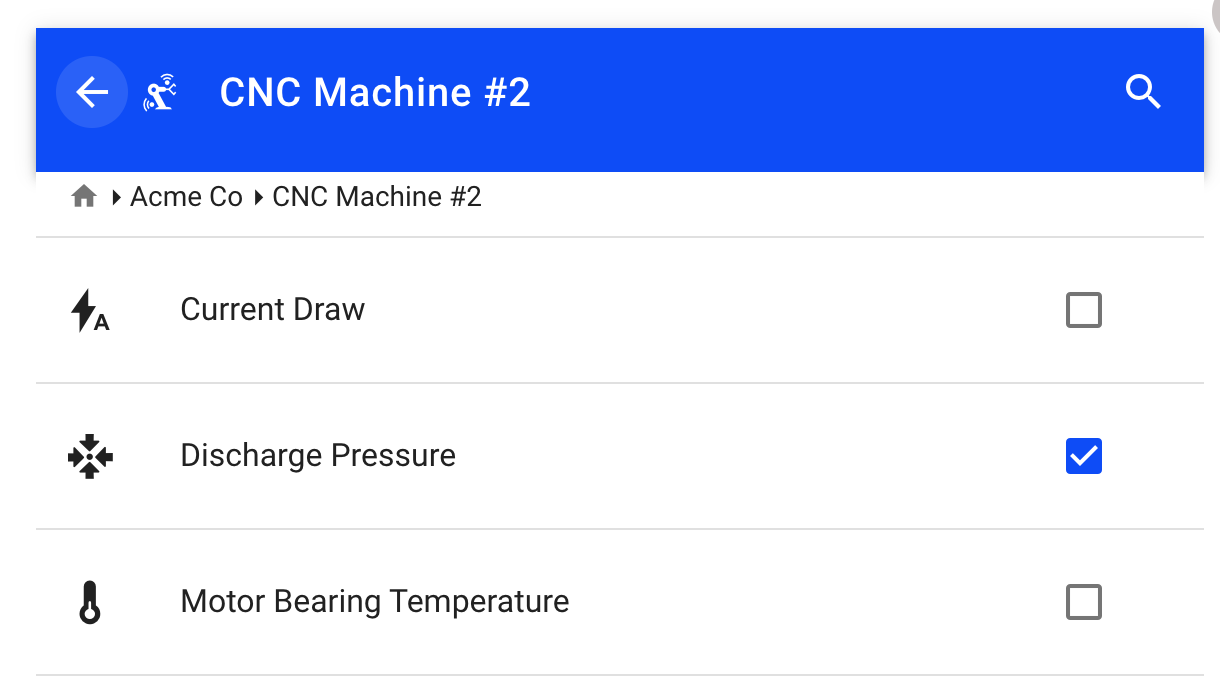
You should see a screen that looks something like this: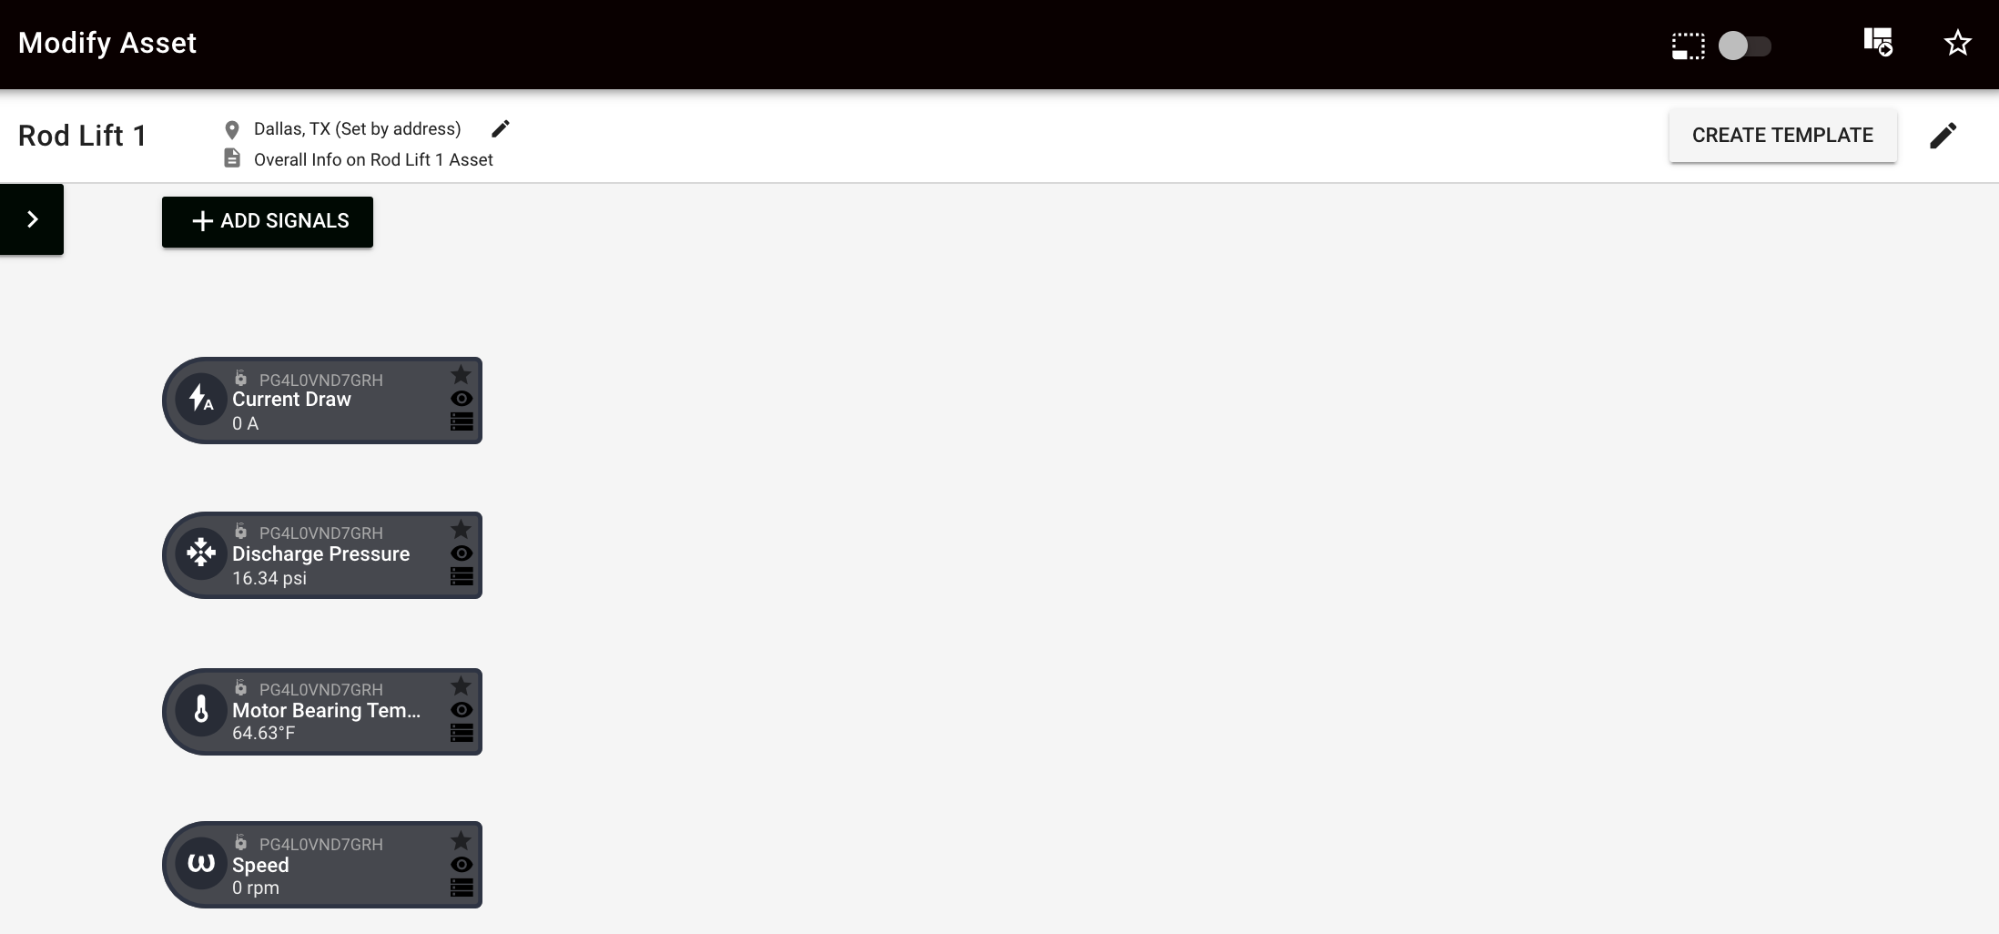
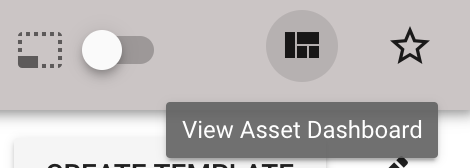
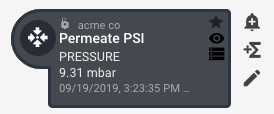
The signals are sorted alphabetically. Under each signal name, there is a value that represents that signal’s current value. - If the data looks correct, return to the dashboard by clicking “View Asset Dashboard.” If the data does not appear, your device simulator is set up incorrectly. Please work through that section again before continuing.
- To add an item to your dashboard, click “+” and you will see a selection of graphs and line charts to choose from.
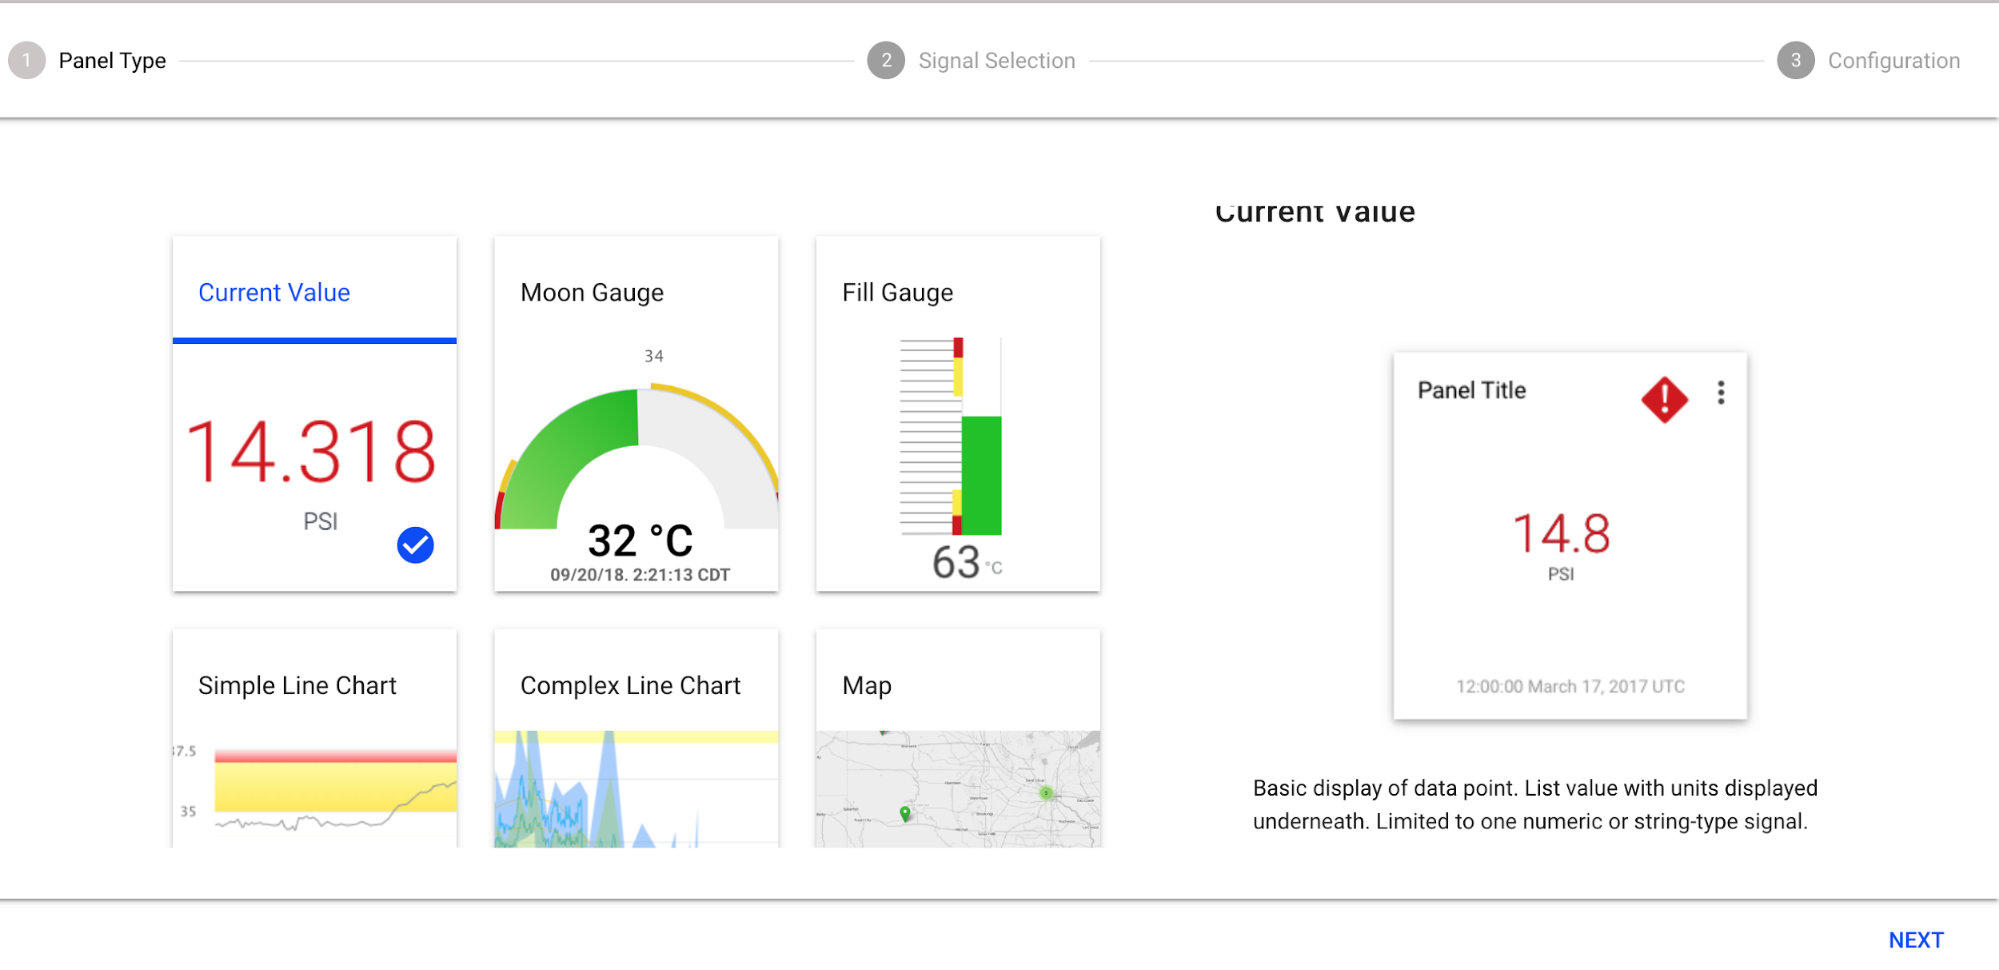
- Choose the type of graph you would like to use and click through the steps.
- Finally, drag and drop the graphs as needed to organize them on your dashboard, but remember to lock the dashboard when you’re done—this is how you save your changes.
NOTE: Although simple line charts only take one signal, complex line charts take multiple signals. If you choose a complex line chart, you can navigate between signals by using the “←” on the top bar.
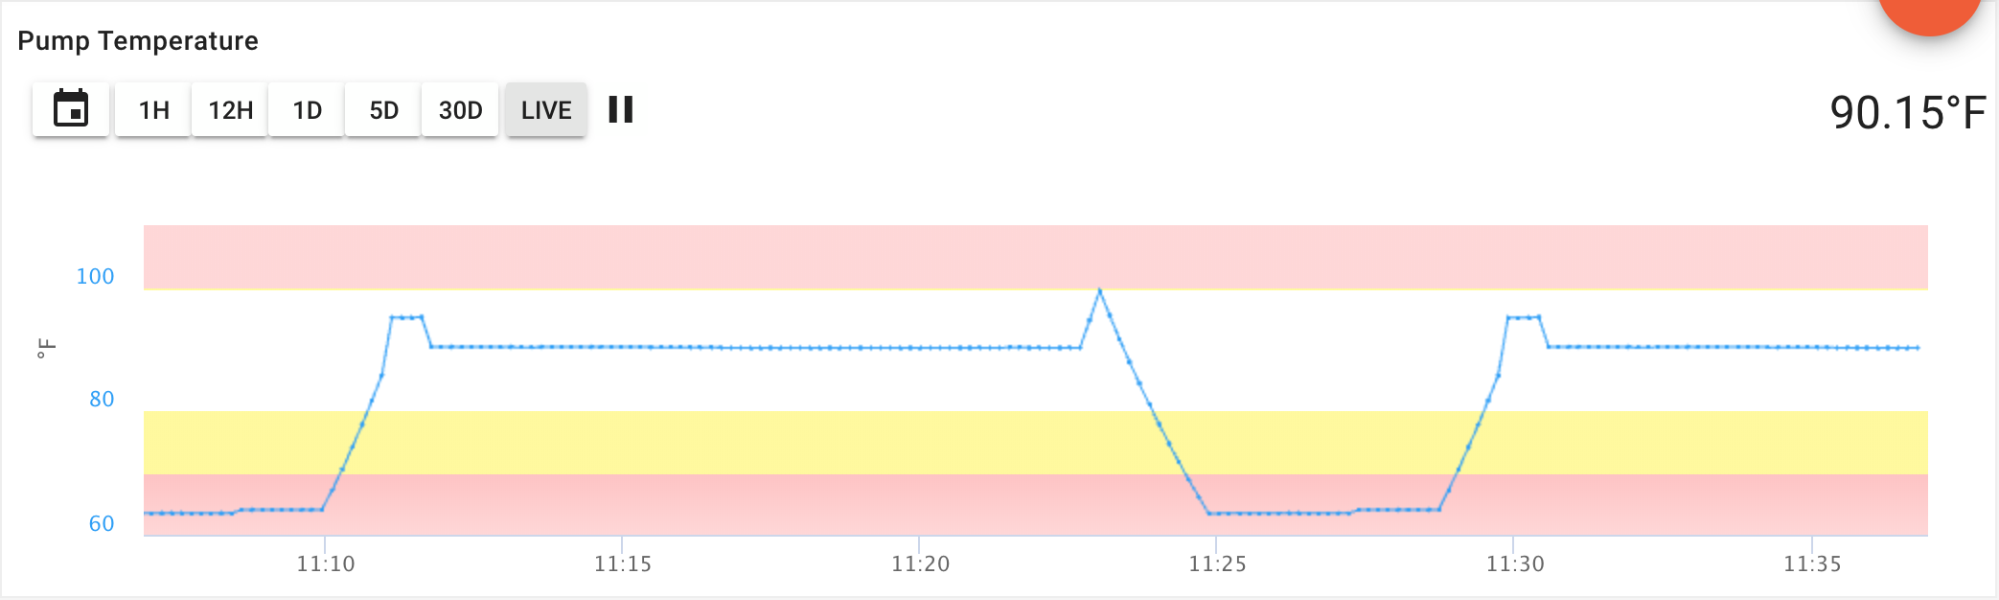
Set Thresholds
Objective: Create a threshold. Thresholds are rules that allow you to set yellow and red warning zones on line charts and gauges. This coloring also carries over to any ‘current value’ panel or asset icon. Thresholds can also be used to set (optional) notifications via SMS or email.
Steps:
- Click the modify asset icon.
- Hover over the signal you would like to use and click the alarm bell icon.
- Set the appropriate thresholds.
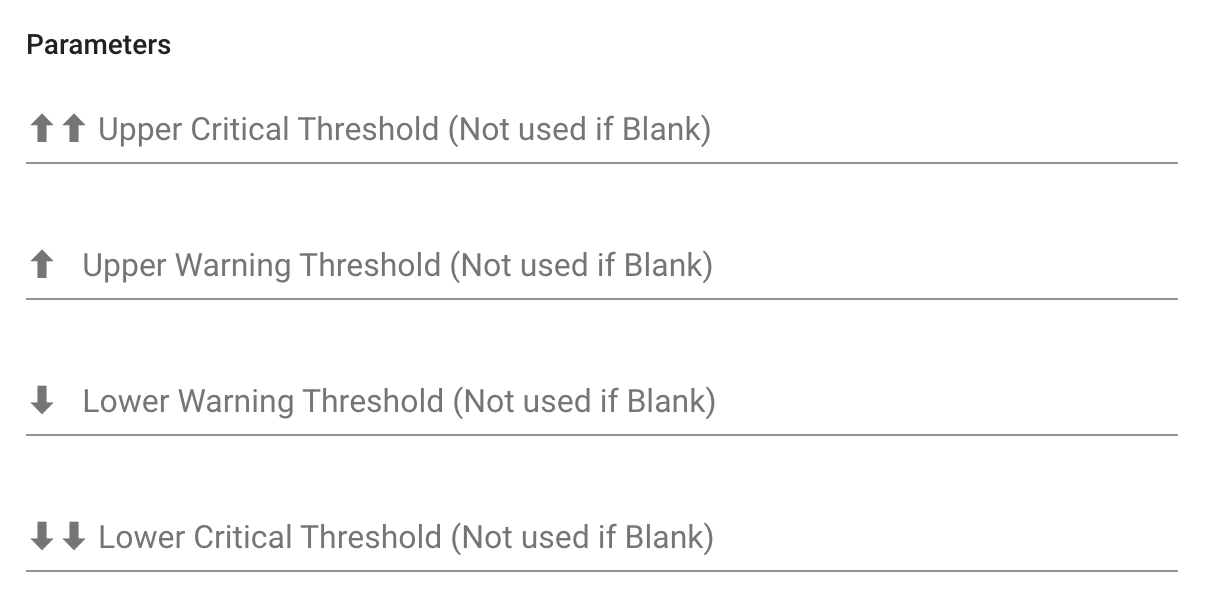
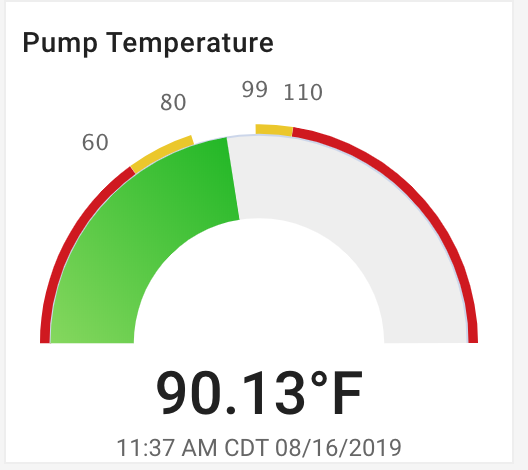
Critical thresholds will appear as red on the graph, and warning thresholds are yellow, as seen below. These thresholds will only appear on a historical graph once the threshold has been crossed.
NOTE: If your threshold doesn’t appear, you may need to edit the graph. Unlock your dashboard and click the pencil icon, then toggle the “Show Thresholds” button.
Create Transformations
Objective: Merge streams of data with an equation. This will allow you to start applying your industry insights.
Steps:
- Click the modify asset icon.
- Hover over the signal you’d like to use in an equation and click the function icon, which contains a drop-down menu of commonly used functions.

Commonly used functions include:
- Join: This combines multiple signals using basic arithmetic.
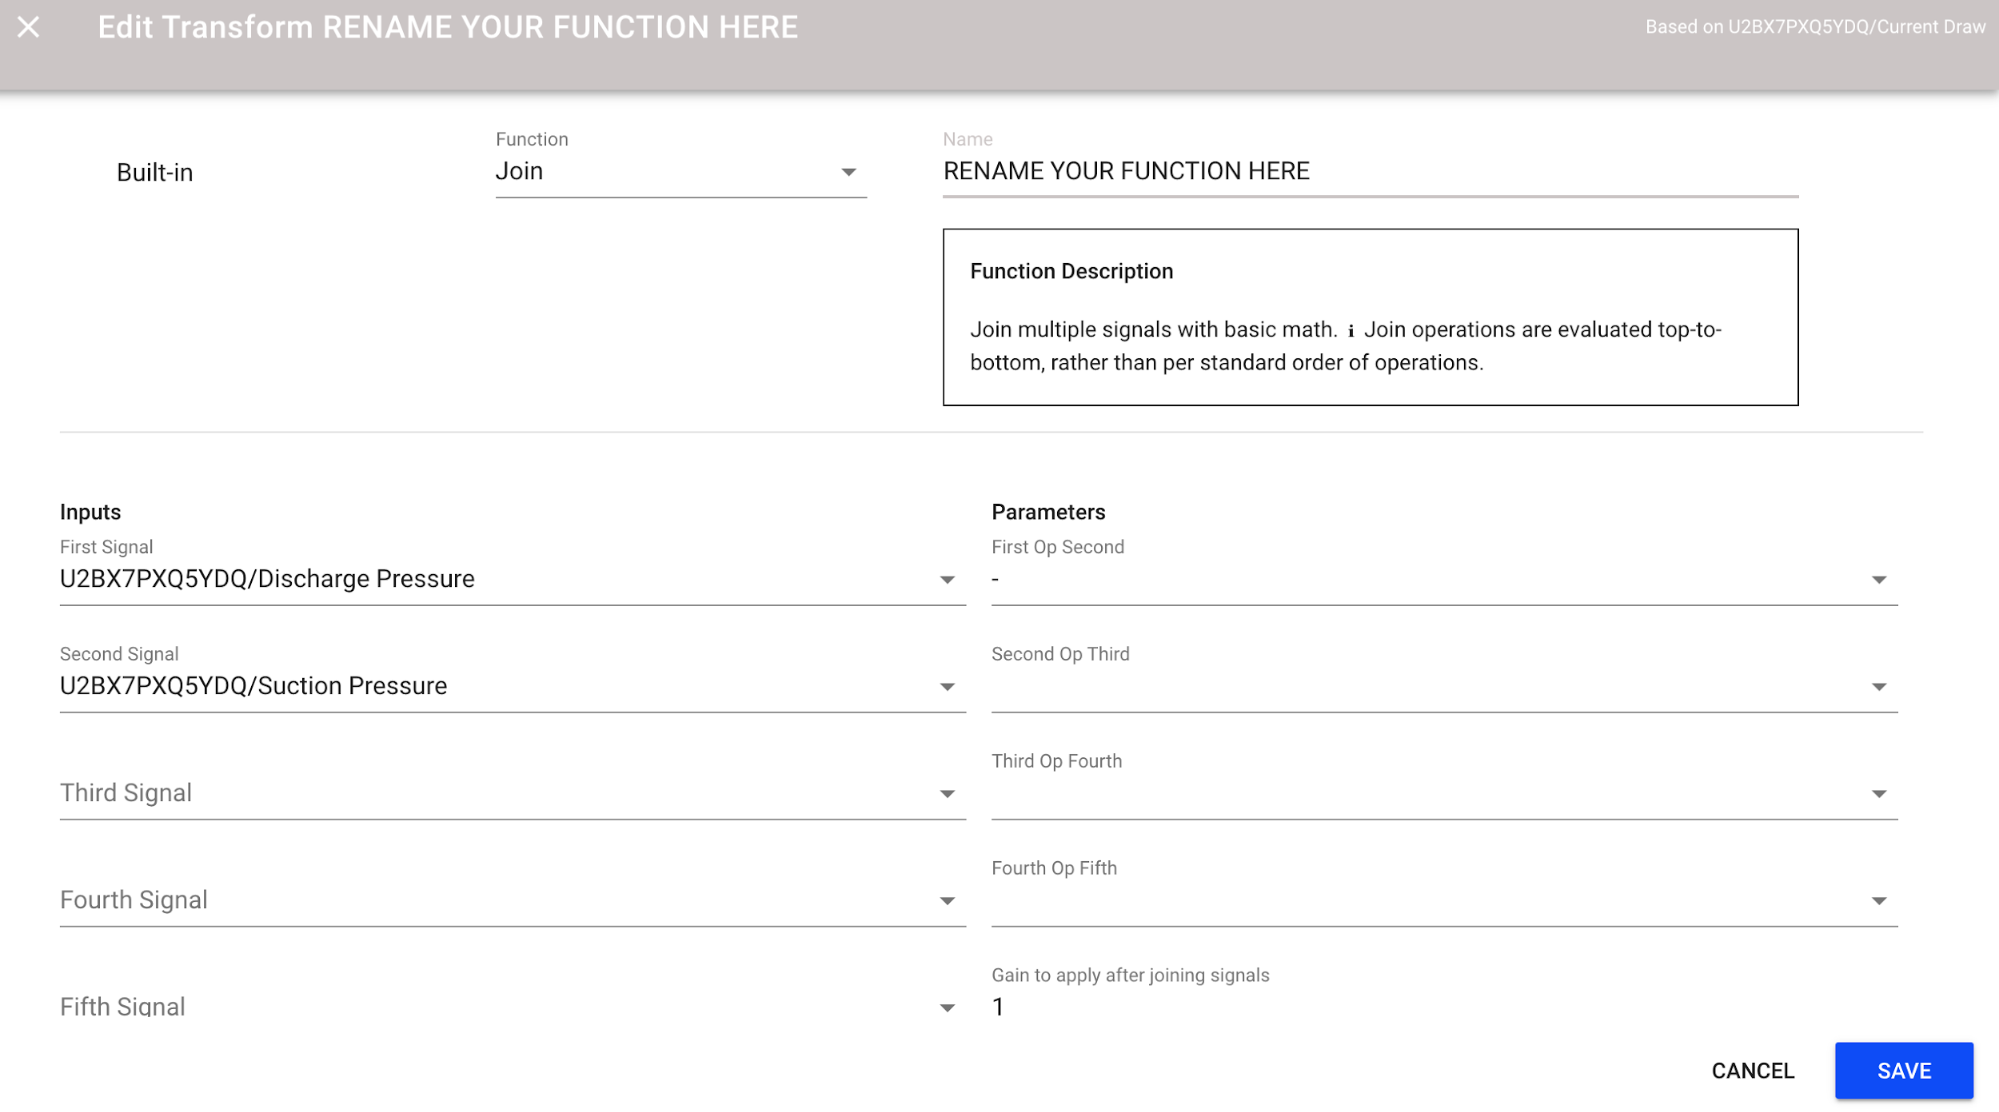
- Linear Gain: This is a y = mx +b format.
For more detailed information about transformations, please see our Standard Transform Insights technical article.
NOTE: You can also create custom functions (and can even choose to host them yourself), but these are more complicated. Since poorly formed equations could result in high processing fees, we recommend contacting the Support Team for guidance and best practices.
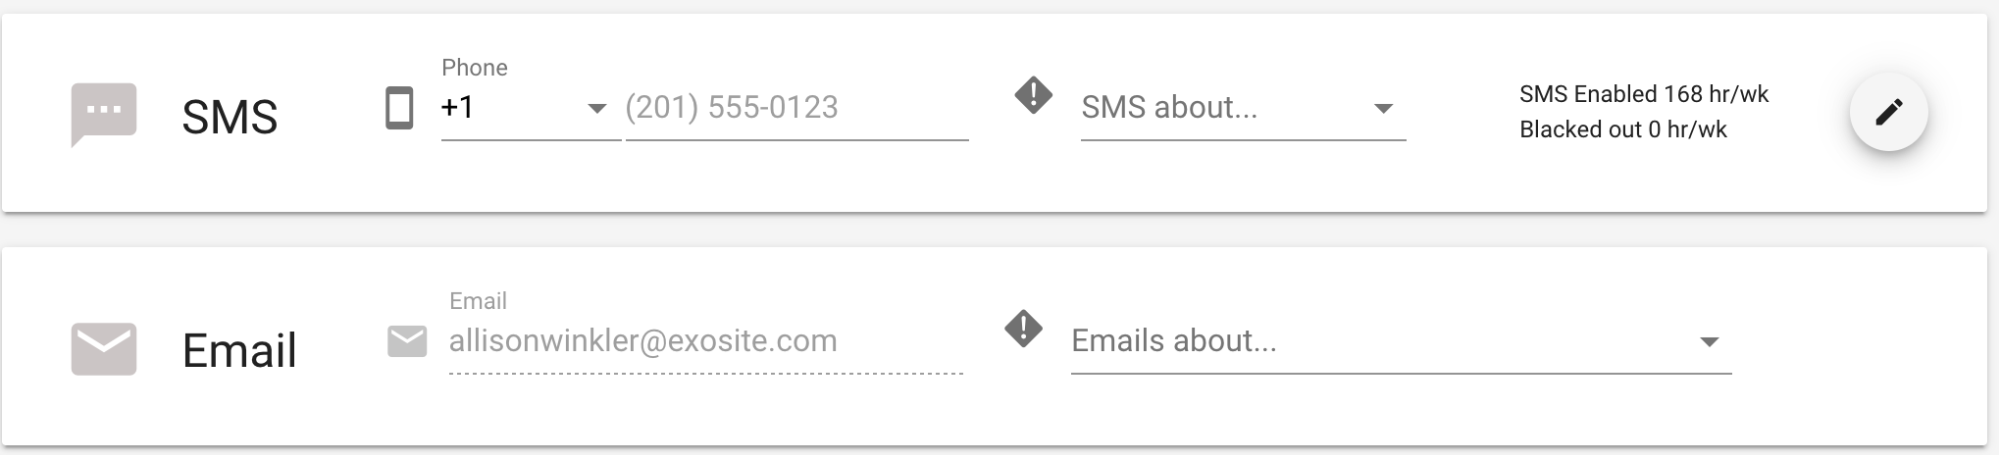
Create Notifications
Objective: Create a notification based on one of the thresholds you just set. The notifications can be via SMS or email.
Steps:
- Click your email address in the bottom left-hand corner of the page and then click “Notifications.”
- Enter the phone number or email address where you would like to receive notifications and select what you would like to receive notifications about.
- Use the pencil icon to select hours that you do not want to be contacted.
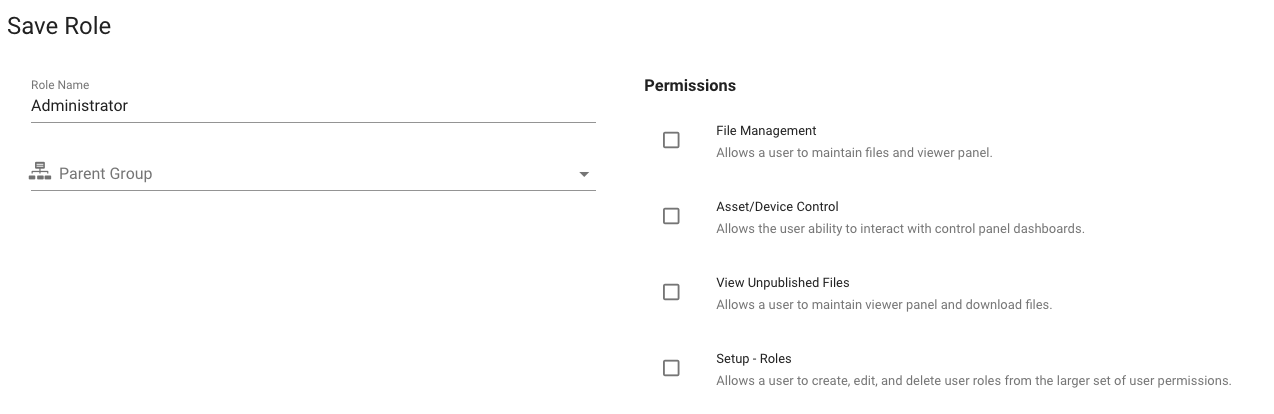
Create Roles
Objective: Add a role with non-admin access. Roles allow you to define what items and privileges users will have access to, so you can start to consider what you would like your users to see and interact with. The default role is “admin” which allows skeleton-key-like access to everything in ExoSense. Because you likely don’t want your admins to have total control, let’s set up an “Administrator” role with slightly different privileges.
Steps:
- Click “Setup” then click “Roles” and “+”.
- Type “Administrator” into the Role Name field, select the parent group you’d like them to have visibility to, select their permissions, and click “Save.”
Create Users
Objective: Add another user. Often, the first users you will add are other contributors to your proof of concept.
Steps:
- Click Users, then click “+”.
- Complete the invitation information, including role and language, and click “Send.” New users will be emailed an invite to access your ExoSense instance.
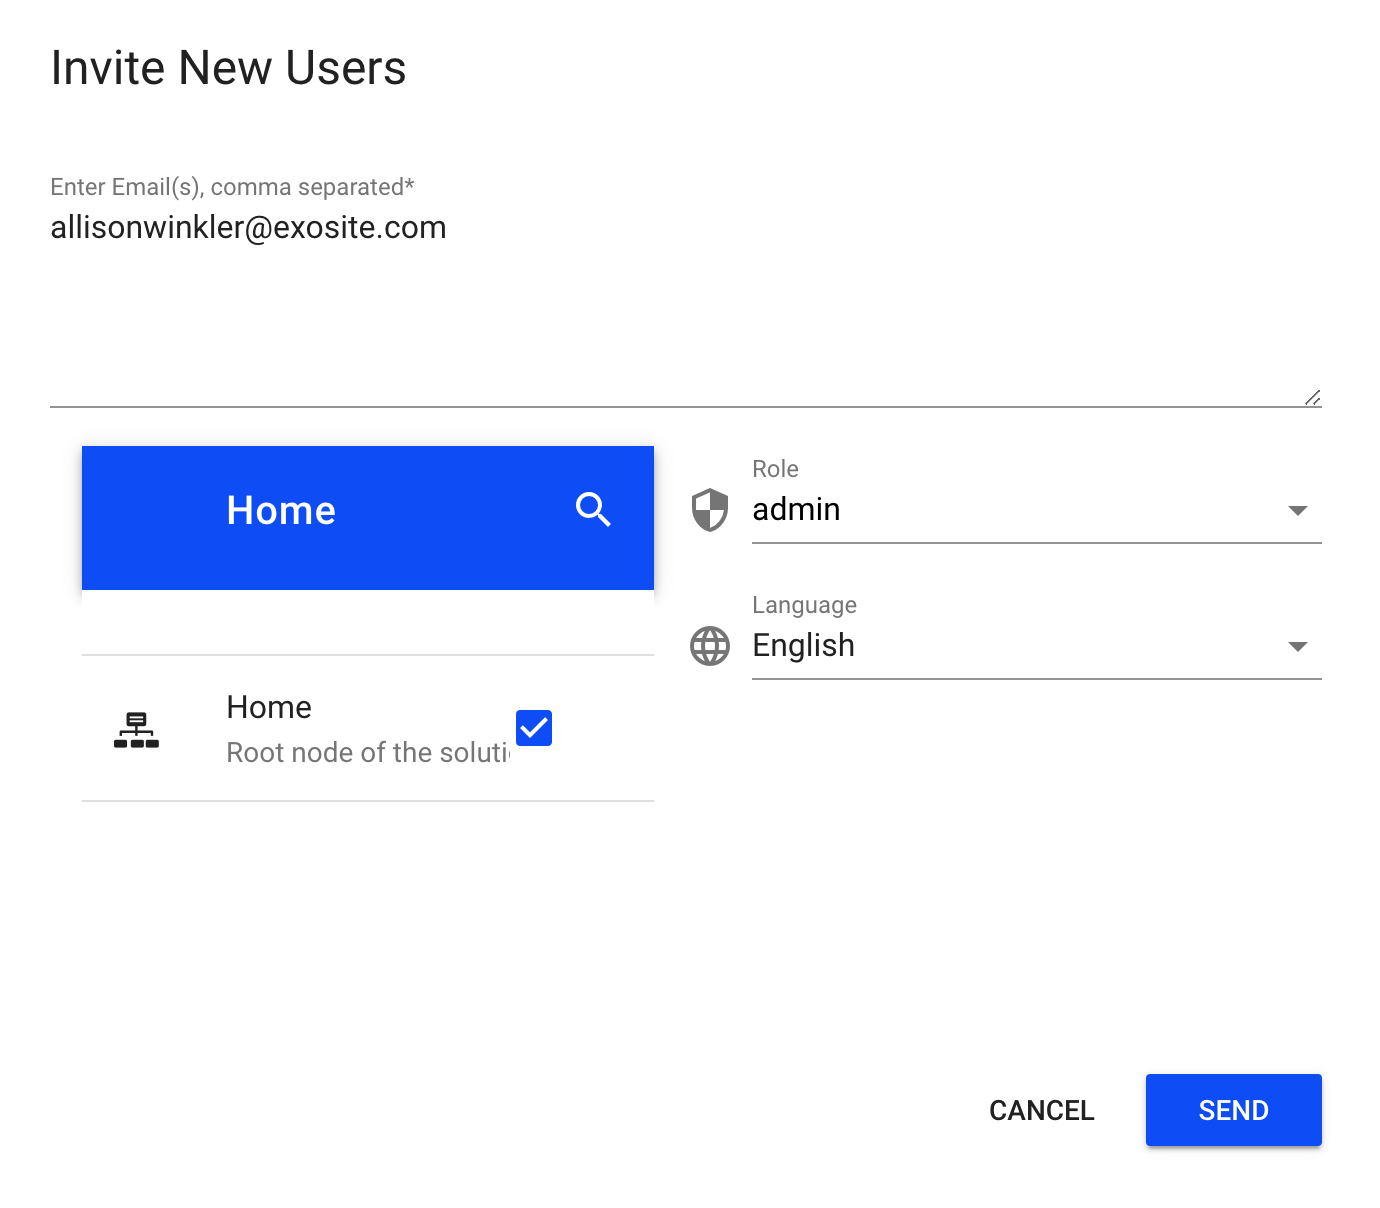
NOTE: If you select the root node, the user will be able to view the entire instance.
Next Steps
Congratulations—you have completed the ExoSense onboarding process. Hopefully you are much more knowledgeable about ExoSense and feel comfortable working in your instance.
If you’d like to explore ExoSense in more depth, please visit the ExoSense technical documentation site or our Device Connectivity article.